Overall Totals
Here you'll find an overview of all my cycling statistics whilst in Wales.

For the most part, I haven't set out to achieve any specific numbers. That is; I don't ride for distance. I just ride my bike to go places and see things. I ride for the shear pleasure I find in pedalling across this lovely little country. So thank you Wales... thank you for being so friendly and beautiful and interesting.

Distances Cycled Each Year (miles)
You can mouseover the chart to view the specific distance for each year.

Number of Days Cycled Each Year
You can mouseover the chart to view the specific number for each year.

Total Elevation Gain for Each Year (feet)
You can mouseover the chart to view the specific number for each year.

Note: You can click on the date shown in the left column to view the details for that specific year.

Calculating Averages
In the charts below, I drill down even further to determine my overall average(s) from the start of my cycling in January of 2012[1]. The averages displayed are: Miles per Ride, Miles per Month, and Rides per Month. You can mouseover each bar to see the average for that year.


Yearly & Monthly Overviews
You may be wondering where all this data comes from? Essentially, I use a Garmin Edge® Explore 2 satellite navigation tool, along with Ride with GPS to track and record every ride I make. I then upload the data into set of Google spreadsheets that eventually make their way to the tables shown below. The data is then filtered, sorted, and compiled to create the various tables and charts seen throughout this site.

2025 Yearly Totals
The data below compiles a summary of my rides during the calendar year.

Summary of Rides
This is a brief overview of my rides for the year. I've also listed a couple of timelines which tracks my progress for goals during the year. And finally, I've included an additional bar chart table comparing my rides of this year to those of the previous year.

Note: You may select a tab below to specify the data by; year, month, week, bike, or distance (Solitaires).

Goals & Achievements
Each year I set myself a modest set of goals. I don't worry too much about my progress or "success"; this merely gives me a few numbers against which to measure my cycling.

Monthly & Yearly Comparisons
Below is a summary of my rides for each month of this year compared to the rides I made during the same month of last year. You can mouseover the bars to view the specific distances for each month.


Additional Details - Yearly Averages
Once you start capturing the data, there's no end to drilling into the details...

2025 Monthly Details
Shown below are my cycling details for each month during the calendar year.

Monthly Overview
The three main categories highlighted on this page are; Distance Cycled, Number of Rides, and Elevation Gain. Additional details of day & date, moving time, average speed, weather conditions, as well as links to the specific route map(s) are included in the table below.

Monthly Ride Details
Listed below are the details for every ride made during each month of the calendar year. The route names listed under the "Maps & Links" column will direct you to the specific route map kindly provided by Ride with GPS (Note: You will be re-directed to their website).

Note: You may select a tab below to specify the data by; year, month, week, bike, or distance (Solitaires).


2025 Weekly Calendar
Local weather and weekly rides made during the calendar year.

Weather Report & Ride Conditions
Recorded below are the daily local weather conditions as reported by the Met Office (Blackwood, Caerphilly) and/or myself during the course of my rides. My cycling distances are also tallied to create an overview of my weekly mileage for the calendar year.

Note: You may select a tab below to specify the data by; year, month, week, bike, or distance (Solitaires).

2025 Rides by Bike
The data below represents all the rides made during the calendar year.

Overview
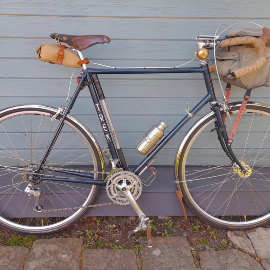
Over the past few years our stable of bikes has expanded. On this page I differentiate the yearly ride details for each specific bike. (Of course too, you may select a bicycle below to drill-down even further for additional details!)
2011
Name: El Camino
1979
Name: Lizzie
1995
Name: Lady Purple
2021
Joroto XM316
Name: JOROTO!
2016
Name: Black Beauty
Coming soon!

Note: You may select a tab below to specify the data by; year, month, week, bike, or distance (Solitaires).


Rides by Bike Details
The tables below showcase every ride by each bike.

2025 Solitaires
Long distance rides are the core of my cycling adventures.

Metric Centuries & More
Distance is NOT my primary goal, but in 2016 I started tracking all of my rides which exceeded 62.14 miles (a metric century). I've created a set of categories for each distance at mulitples of 25k and assigned that distance a specific colour. You can view a table for "What the Colours Mean" below.


Note: You may select a tab below to specify the data by; year, month, week, bike, or distance (Solitaires).

2025 Walking Totals
The data below compiles a summary of all our walks during the calendar year.

Summary of Walks
Starting in January of this year, my wife and I began taking daily walks around our village as both a means of exercise and as a way of spending more time together. We downloaded the MapMyWalk app to our phones and off we went. Naturally, this often includes a stop at our local bakery for coffee & cake! It's been brilliant.


Goals & Achievements
For our first year of walking we've taken on the MapMyWalk 2025 Challenge to walk a total of 1025 kilometers for the year. It's a big one, but we're excited to give it a go!
Distances shown in the charts above & below are in kilometers.
In order to achieve our goal, we need to walk 84.41 km per month (roughly). The chart above shows how those kilometers accumulate over the next 12 months.

Monthly & Yearly Totals
Our first months and year actively walking and recording our efforts.

Yearly Averages
With every month, these figures should tell the story of our consistency.